The Problem: Floods, Sediment, and Restoration Uncertainty
In 2011, severe floods in Southeast Queensland caused widespread riverbank erosion, sending huge amounts of sediment downstream.
This not only damaged water quality and treatment facilities but also increased dredging demands at the Port of Brisbane.
Rehabilitation projects were underway in various catchments within Southeast Queensland, but Cyclone Debbie in 2017 highlighted the potential vulnerability of these sites.
The big question remained: how could rehabilitation success be measured, and investments justified?
Traditional on-ground monitoring was inconsistent, subjective, and difficult across inaccessible areas due to land ownership in and around key sites.
Without clear context on surrounding land use, stakeholders struggled to agree on whether restoration efforts were truly working, and if they were not, why?
A new approach was needed, one that provided this Queensland water utility customer with context, flexibility, efficiency, confidence and importantly, was also fit-for-purpose.

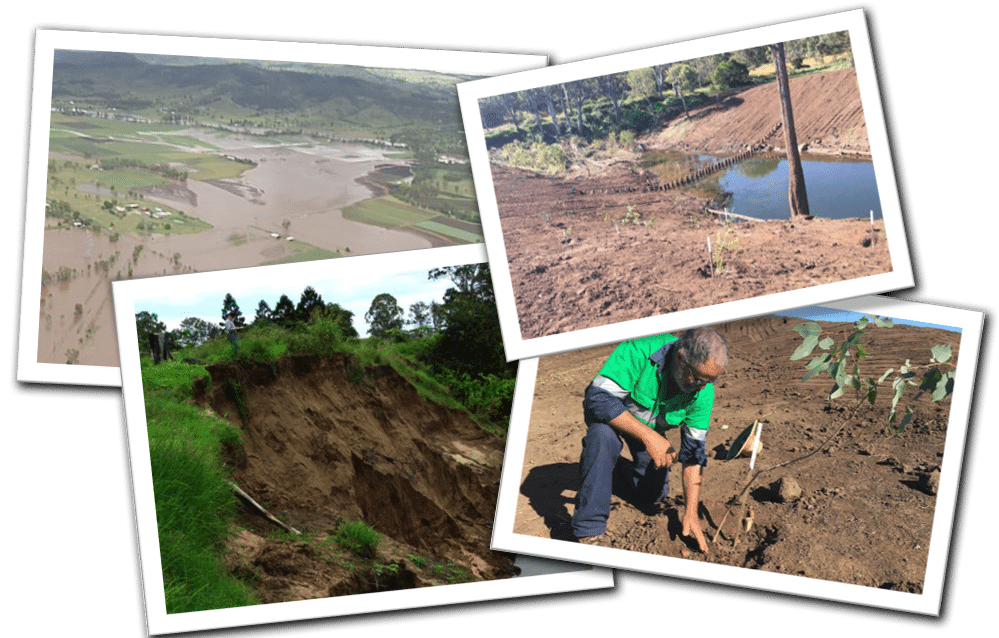
Between the floods of 2011 and following Cyclone Debbie in 2017, multiple riverbank stabilisation and rehabilitation projects
have been undertaken across southeast Queensland. Photos sourced from ABC News circa 2017.
The Monitoring Challenge
- It is difficult to quantify the success of re-stabilisation works and green assets in dynamic settings.
- Regular site access and measurements on foot are limited, sometimes impossible.
- On-ground information is often subjective, especially when multiple parties are involved over time.
- There is a lack of contextual data about surrounding land uses.

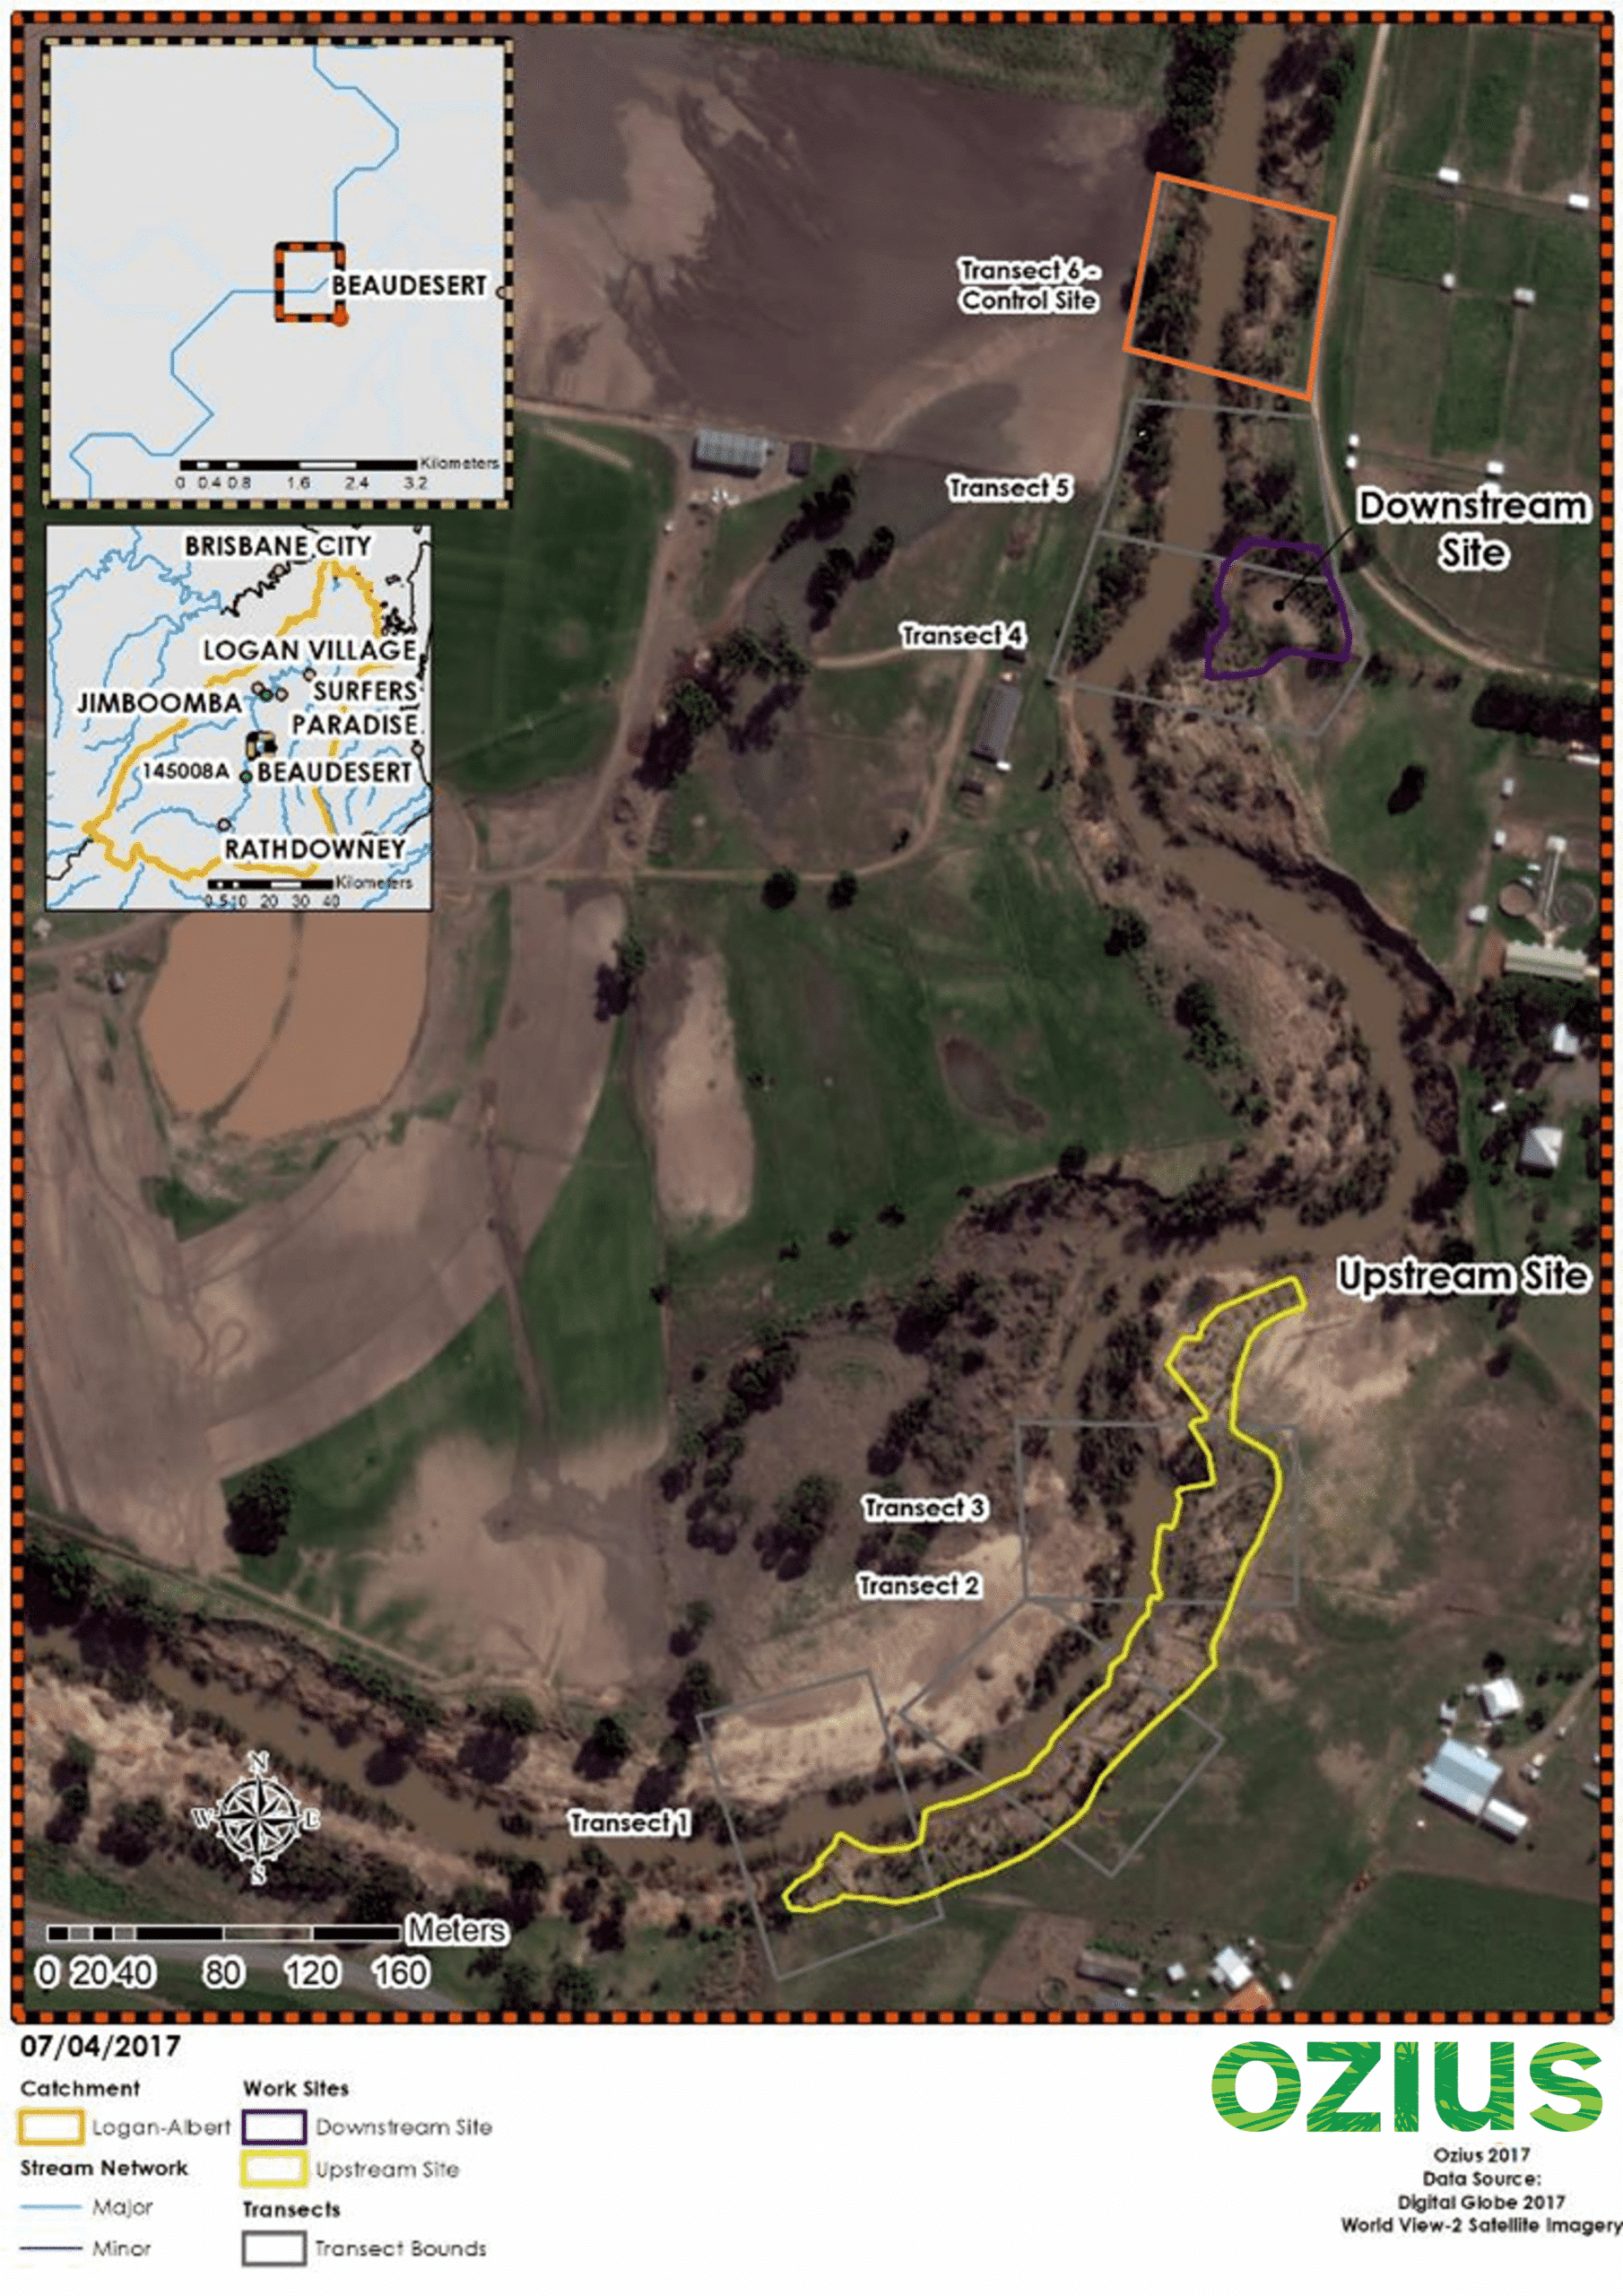
The subject site following Cyclone Debbie. The site had previously undergone significant rehabilitation works after the 2011 floods that impacted Southeast Queensland.

Key outcomes and Ozius’ proven Earth Observation analytics engine
Ozius delivered an innovative monitoring solution that integrated hydrology and climate data with satellite imagery and the clients existing on-ground field observations and Lidar. Our Earth Observation analytics engine (Ozius Biome) created a clear, time-series view of each site’s progress, tracking rehabilitation milestones from pre-restoration through to four years’ post-rehabilitation. The Ozius approach demonstrated the following:
- Success could be quantified remotely.
- Anomalies could be detected early, prompting targeted on-ground interventions.
- Executive-friendly dashboards could be delivered providing accessible reporting for decision-makers.
Subject Site Over Time
By mapping sites across key dates (2013, 2014, 2016, and 2017) Ozius clearly showed the journey from erosion, through early restoration, to post-Cyclone Debbie resilience (shown in the video below)
This visual storytelling gave stakeholders a shared understanding of progress that words and spreadsheets alone could not capture.
Landcover Classification: Breaking Down the Environment
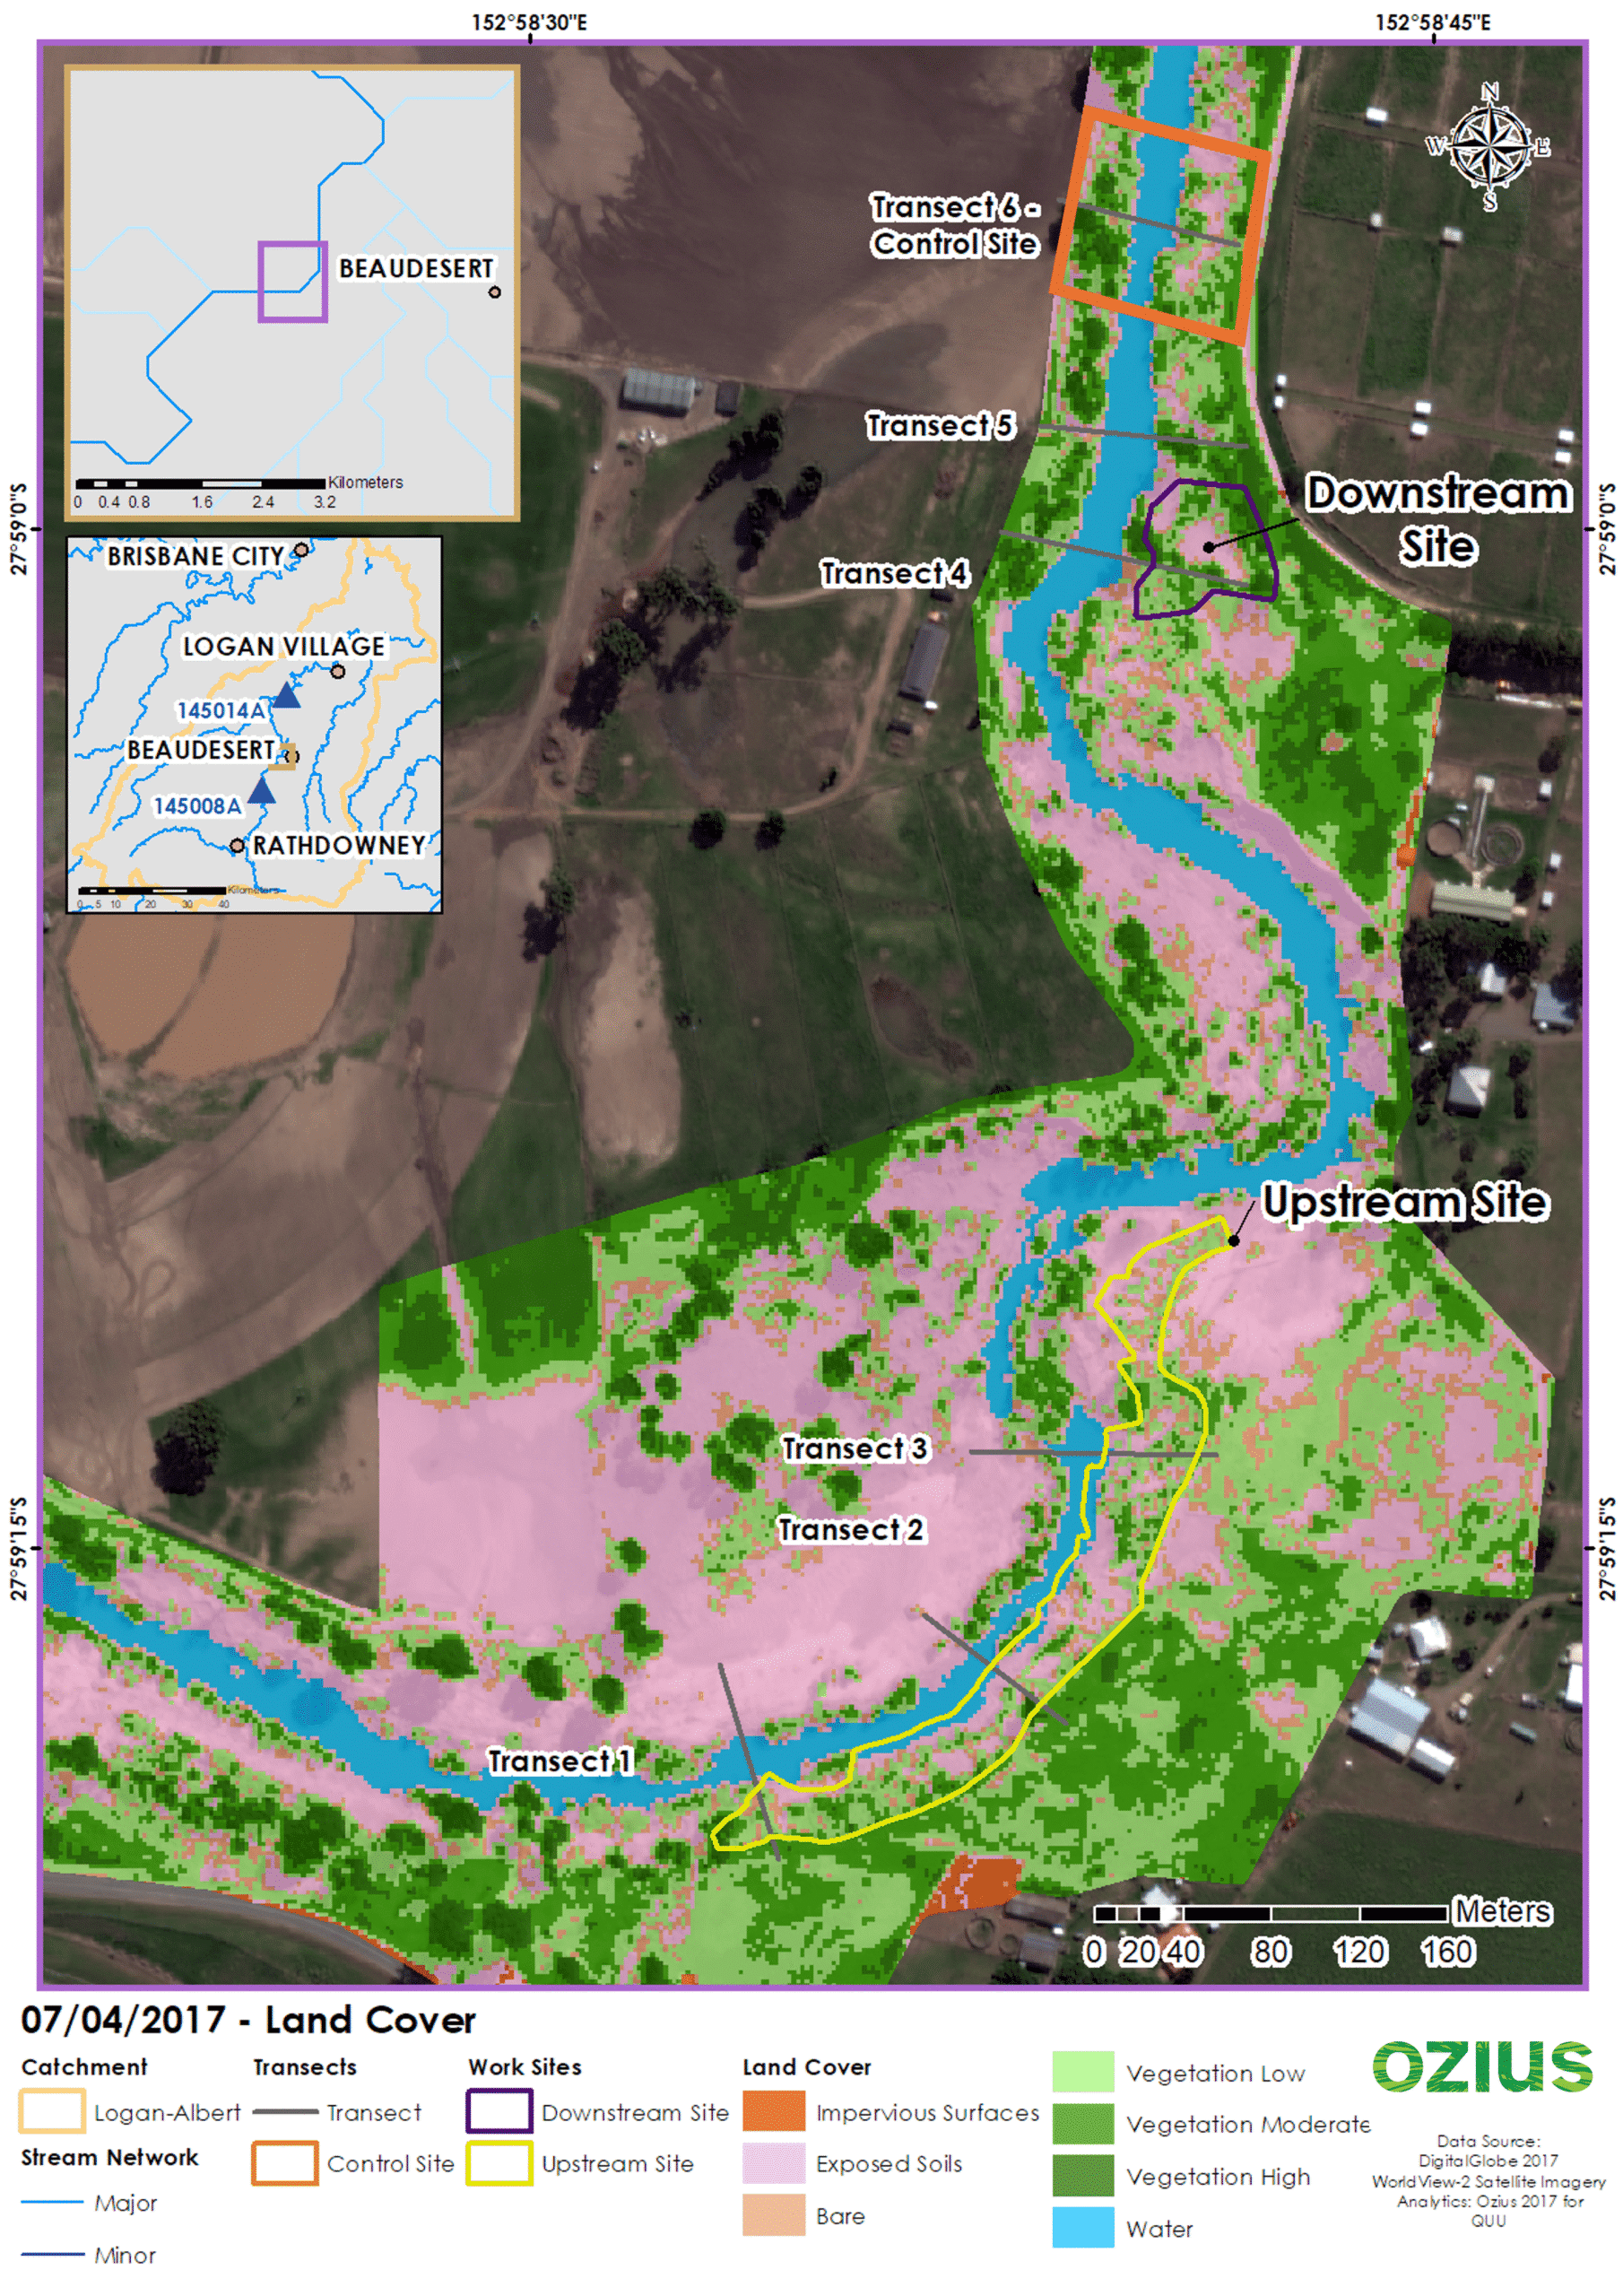
Using advanced classification models, Ozius provided insight into landcover types of interest to the customer. These included impervious surfaces, exposed soils, key vegetation biophysical properties (classified as low, moderate, high), and water presence.
The Ozius classification methods always go beyond asimple NDVI analysis, showing not just “greenness” but the actual structure and vitality of the landscape, and where necessary, comparative analysis against key benchmark sites.
The Landcover product provides additional information to aid in understanding the drivers of change in the rehabilitation of offset sites across the areas of interest being monitored.
The Land Cover classification is comprised of the following classes:
- Impervious Surfaces – hard surfaces that do not allow an infiltration of surface water.
- Bare/Exposed Soils – surfaces that are comprised of exposed soils with no ground cover.
- Vegetation Low – Non woody vegetation groundcover or lower structural attributes and or vegetation with lower vegetation vitality.
- Vegetation Moderate – Vegetation with a woody structure and a moderate vegetation vitality, ie. as shrubs and bushes and trees.
- Vegetation High – Vegetation with a woody structure and a moderate to higher vegetation vitality i.e. established trees.
- Water – open waterbodies including rivers, estuaries, creeks, dams and private waterbodies.
Control Site Analysis: Establishing a True Benchmark
By comparing active rehabilitation areas with control sites, Ozius established a true benchmark. The analysis proved that upstream and downstream sites were on a healthy trajectory, even after Cyclone Debbie. Rehabilitation was not only working, but resilient.
Control Site Landcover Analysis
Upstream Site Landcover Analysis
Benefits of Effective Control Site Analysis
- We can compare sites directly, including against offsite benchmarks.
- By integrating operational and natural events, Ozius provides spatial and temporal context to track rehabilitation progress and prioritise areas for action.
- Decisions can be made quantitatively and remotely, optimising triggers for intervention within and between sites.
- We have demonstrated the integration of Gauge data with Ozius Analytics to optimise on-site actions and future data collection campaigns.
- The same information can be used for success reporting and integrated into enterprise systems to build a body of corporate knowledge.
Landcover Analysis Key Findings
- Net change overall indicates improvements across the site.
- Progressive change during the Cyclone Debbie epochs (2016–2017) shows losses across all sites, including upstream, downstream, and control areas.
- Natural events such as Cyclone Debbie can trigger the need for on-ground management.
- Rapid response analysis using satellite imagery can provide valuable context and extent of impacts – a valuable measure of success for future investment in re-stablisation works.
Key Findings & Benefits for the Customer
- Net change confirmed site improvements.
- Natural events triggered targeted on-ground management, instead of guesswork.
- Rehabilitation was on track, with no unnecessary interventions required.
- The customer gained trend-based intelligence instead of single data points.
- Early warnings enabled smarter risk management.
- Community engagement improved, as visuals and metrics made progress easy to understand.
Benefits
- Ozius converted single points in time into trend information.
- No site visit was required to complete the analysis.
- Local and regional first assessments could be made after significant weather events without setting foot on site.
- Multiple questions were answered with less effort.
- Success was quantified and potential risks were identified.
New Intelligence Provides
- Benchmarks of success to meet reporting requirements.
- Learnings to improve implementation at new sites.
- Reduced field time through event-based triggers.
- Updated metrics to feed into new hydrological models for better predictive modelling of risk and resilience.
Data Inputs
This project leveraged multiple data sources including the following:
- Airbus Pléiades – Optical 4-band Multispectral Very High-Resolution Satellite Imagery: Panchromatic Resolution: 0.5m; Multispectral Resolution: 2.0m Pléiades | Very High-Resolution (50cm) Satellites Imagery
- Maxar WorldView 2- Optical 8-band Multi-spectral Very High-Resolution Satellite Imagery: Panchromatic Resolution: 0.5m; Multispectral Resolution: 2.0m WorldView-2
- Customer provided Aerial Lidar
- Customer provided on-ground field observations.
Why Partner With Ozius?
From raw data to reliable environmental intelligence.
Why Work With Ozius?
- More than data, real insight. We transform complex environmental data into actionable intelligence.
- Expertise you can trust. Decades of experience in Earth Observation analytics, fused with on-ground intelligence from field surveys and IoT devices.
- Long-term solutions. We design monitoring programs aligned with strategic goals, delivering ongoing annual assessments and rapid, event-based responses.
- Proven resilience. Our approach safeguards against future vegetation and biodiversity loss through robust, scalable programs.
- Precision at scale. Proprietary algorithms provide consistent, stable comparisons across time and geography, from individual sites to entire catchments.
- Biophysical accuracy. Unlike simplistic “greenness” or NDVI measures, we use comprehensive biophysical metrics that capture cover, height, and structural change.
- Future-proof intelligence. Our methodology ensures the sensitivity and specificity needed to manage natural assets effectively, even under changing climatic conditions.
Confidence in every decision.
Partner with Ozius to access reliable, evidence-based environmental intelligence you can act on.
For more information contact us at info@ozius.com.au or follow us here on LinkedIn Ozius
